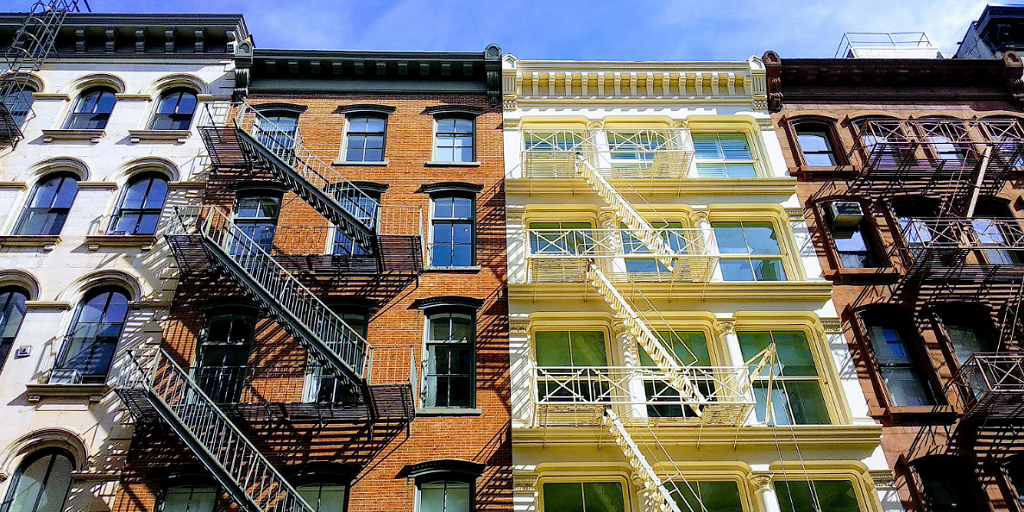
Today, I explain how I design my logo for the blog from the one drawn by Sébastien Rochette for my thesis and the method of traveling salesperson by Antonio S. Chinchón.
I use function writed by Evan Tachovsky.
After verifying that there is no one missprint in the data and before starting the true statistical analysis, I check the distribution of data and relationships between factors.
Actually I analyse data from a thesis which measure urbanisation’s influence on physicochemical characteristics. The PhD student sample water once by month during 2017 at seven spots around a lake.
I think it is a nice occasion to explain how I check the data when I received them.

