Start with the data
Check the distribution of data and relationship between factors

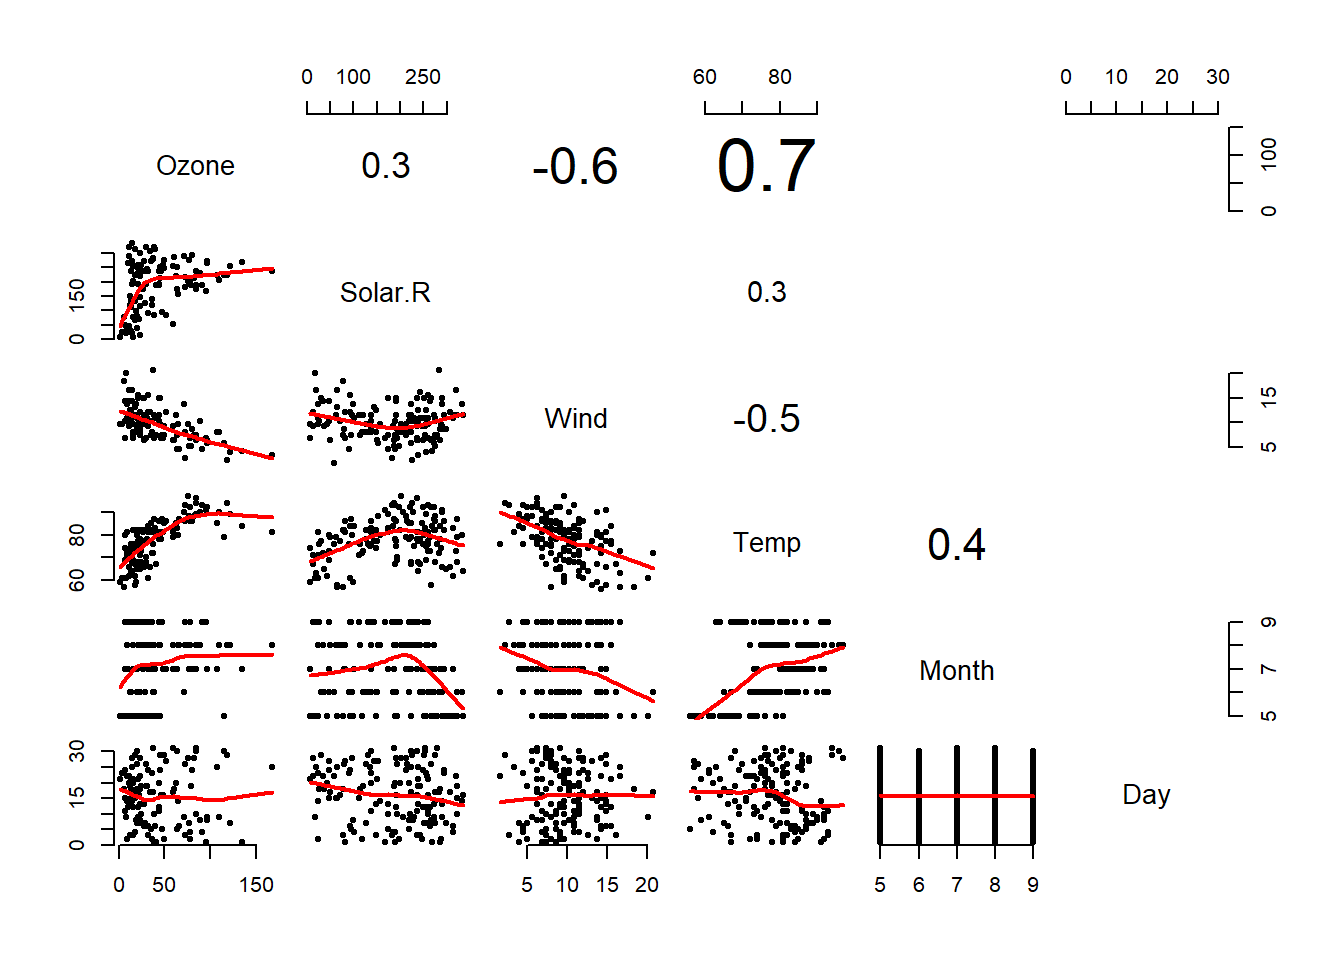
After verifying that there is no one missprint in the data and before starting the true statistical analysis, I check the distribution of data and relationships between factors.
For this blog article, I use data of air quality available in R.
The distribution of each variable
To see distribution, I use a ggplot.
library(tidyverse)
D<-airquality

# First time transform data of tidy ones
D_tidy<-D %>% tidyr::gather(VAR, value, -Month, -Day) %>% mutate(Time = Month*30.5+Day)

ggplot(D_tidy) + geom_line(aes(x=Time, y=value, color=Month)) + scale_color_distiller("Month", palette = "Spectral") + facet_wrap(~VAR, scales = "free_y") + theme_minimal() + ylab("")
We can see there are missing value in Ozone but it is not an issue.
The multi-test of correlations
To see which variable varies with another, I analysed correlation with cor.test.
I used the following code lines with R modified from Zuur et al. (2010)).
D<-airquality

par(bty="n") # I prefer when box was delete from plots but it is not a necessary

# I re-write panel.smooth to change the shape of points and thickness of the red line
panel.smooth2=function (x, y, col = par("col"), bg = NA, pch = par("pch"),
    cex = 1, col.smooth = "red", span = 2/3, iter = 3, ...)
{
  points(x, y, pch = 20, col = col, bg = bg, cex = cex)
    ok <- is.finite(x) & is.finite(y)
    if (any(ok))
        lines(stats::lowess(x[ok], y[ok], f = span, iter = iter),
            col = "red", lwd=2,...)
}

# I modfied panel.cor to show estimate for only significant cor.test
panel.cor <- function(x, y, digits=1, prefix="", cex.cor)
{
  usr <- par("usr"); on.exit(par(usr))
  par(usr = c(0, 1, 0, 1))
  r1=cor.test(x,y)
  r <- abs(cor(x, y,use="pairwise.complete.obs"))

  txt <- format(c(r1[4], 0.123456789), digits=digits)[1]
  txt <- paste(prefix, txt, sep="")
  if(missing(cex.cor)) cex <- 0.9/strwidth(txt)
  text(0.5, 0.5, if(r1[3]<0.005) txt, cex = cex * r)
}

pairs(D, lower.panel = panel.smooth2, upper.panel=panel.cor, cex.labels=1.3)
My main modification is the blank when correlation test was not significant.
In the upper triangle, number is estimate of the correlation between the line variable and the column one.
And you, how do you do multi-test of correlations?


Share this post
Twitter
Google+
Facebook
Reddit
LinkedIn
StumbleUpon
Pinterest
Email